You run several EAs on one account, plus a few trades by hand. The balance shows the total. It does not show which EA earns the money and which one gives it back. MetaTrader's history lists individual deals, and one trade can consist of several of them.
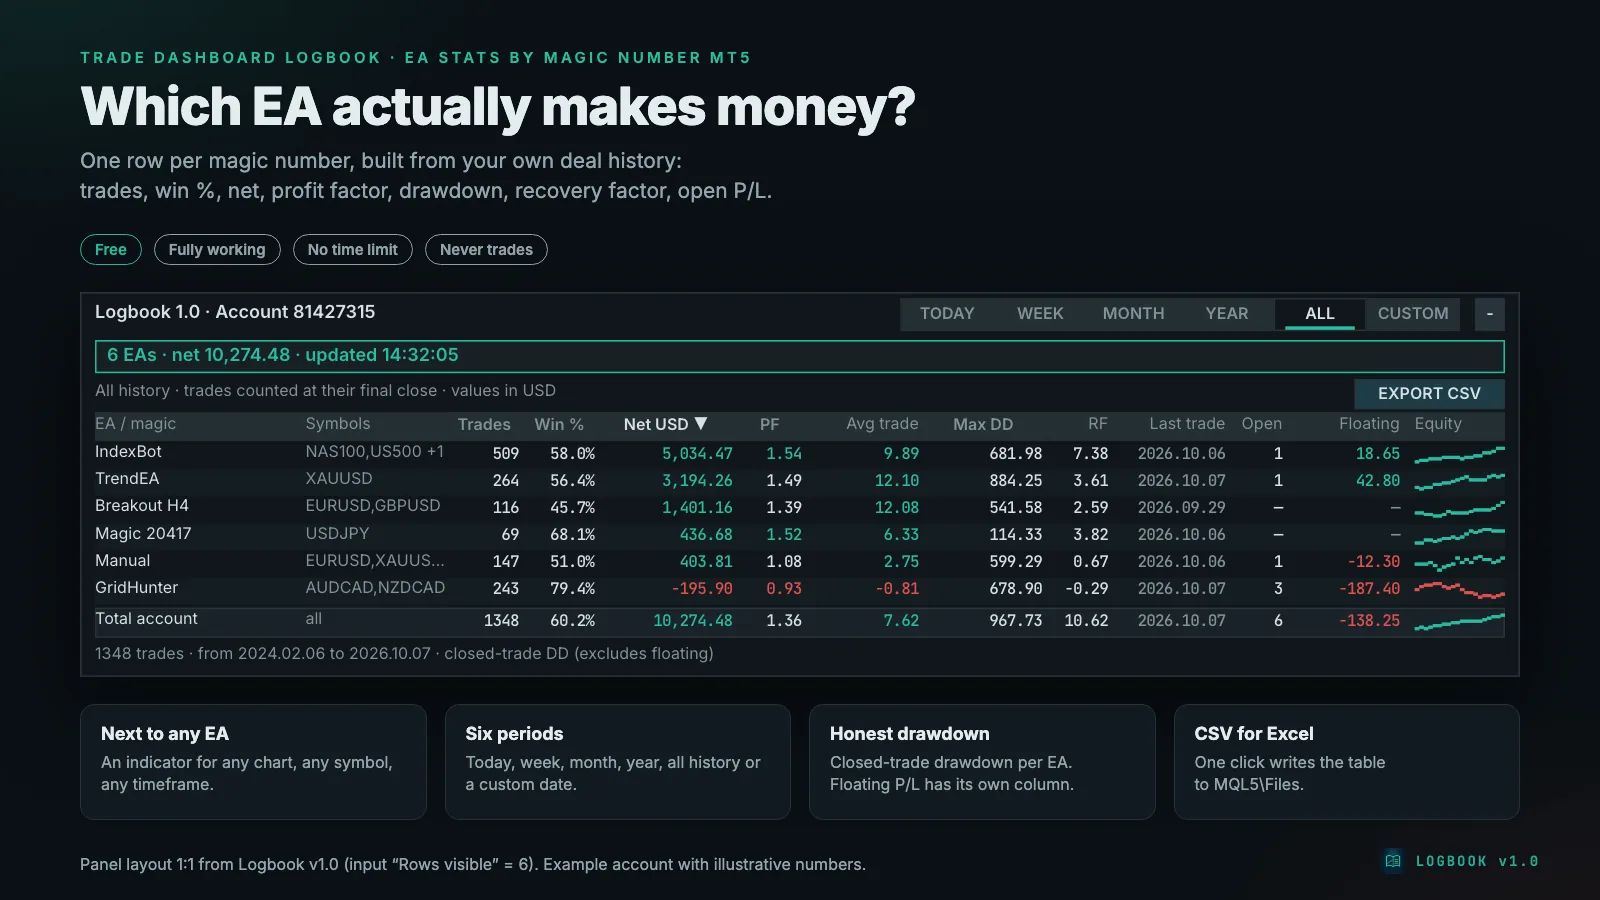
The Trade Dashboard Logbook is a chart indicator for MetaTrader 5 that answers that question. It reads the deal history of your account and shows one row per magic number: trades, win rate, net profit, profit factor, drawdown, recovery factor, open positions and floating profit or loss – for today, this week, this month, this year, all history or a date you choose. It never opens, changes or closes a trade.
Status 9 October 2026: Logbook 1.0 is finished (test status below) but not yet released on the MQL5 Market. It is planned as a free product. There are no user reviews yet.
How deals become trades
MetaTrader stores deals – individual fills. One trade can consist of several deals: an entry, additions, partial closes and the final close, plus swap and commission. Logbook rebuilds trades from them, and the rules decide whether the numbers are right:
- The whole history is always loaded from the account start, whatever period you look at. A trade closed this week may have been opened last week, and its opening deal holds the magic number and often the entry commission.
- Deals are grouped by position id. A trade starts with the first opening deal of a position and ends when the position's volume is back at zero.
- The magic number comes from the opening deal. Closes by stop loss, take profit or stop-out often carry magic 0; if Logbook used them, an EA's losing trades would show up as "Manual".
- The result of a trade is profit + swap + commission + fee of all deals of that position.
- Partial closes make one trade. It is counted when the last part is closed, in the period of that final close, and includes every part.
- Netting accounts: a reversal closes the old trade and opens a new one. A position touched by several magic numbers is shown under Mixed (netting); closes with magic 0 never make a position mixed.
- Costs booked separately (commission, charges, dividends, taxes as their own deals) join the trade they name, even after it is closed. Costs without a usable position are listed on a separate Unattributed costs line, outside the rows and the total.
- Deposits, withdrawals, credit, bonus and other non-trading entries never count as trades.
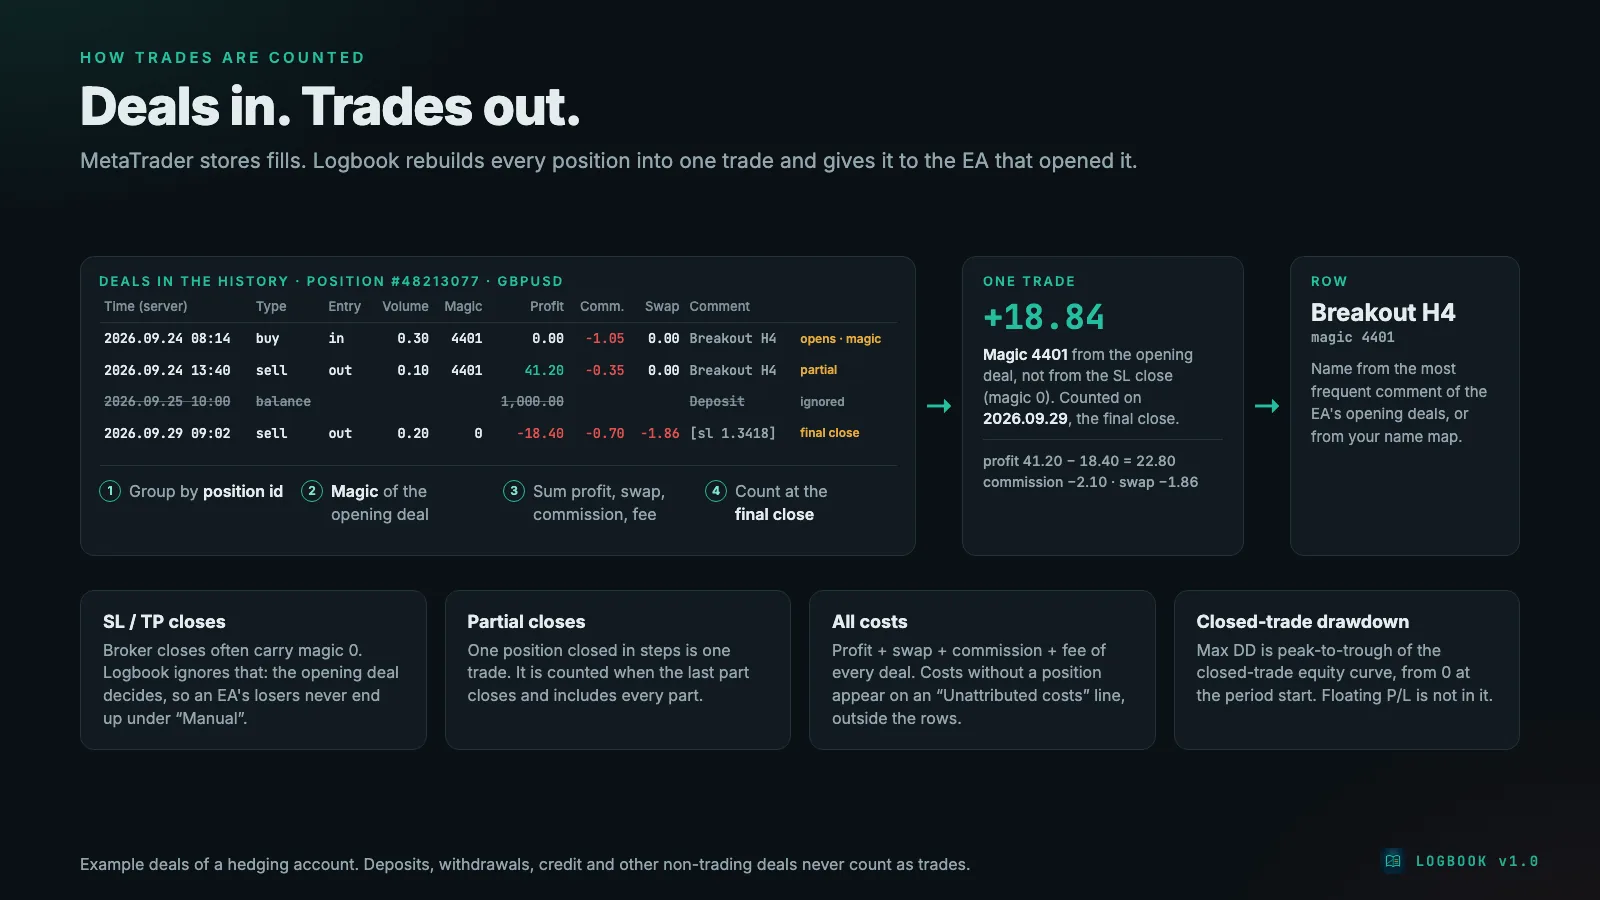
Names. For each magic number Logbook uses the first of these that exists: your entry in the Names input (for example 12345=TrendEA;777=IndexBot), "Manual" for magic 0, the most frequent comment of that EA's opening deals, or "Magic 12345".
Every metric
All money values are in the account currency. Trades means the closed trades of the row whose final close falls into the period.
| Column | Definition |
|---|---|
| EA / magic | Name, see above |
| Symbols | Symbols traded by this magic: up to two names, then "+n" |
| Trades | Number of closed trades |
| Win % | Wins divided by trades. A win has a net result above 0, a loss below 0; a breakeven trade counts as neither, but counts in Trades |
| Net | Sum of the net results (profit + swap + commission + fee) |
| PF | Profit factor: gross profit divided by gross loss. No losing trade: "—" (infinite). No winning trade but losses: 0.00 |
| Avg trade | Net divided by trades |
| Max DD | Largest drawdown of the row's closed-trade equity curve, in money |
| RF | Recovery factor: Net divided by Max DD; "—" if Max DD is 0; can be negative |
| Last trade | Date of the latest final close in the period |
| Open / Floating | Positions of this magic that are open now, and their current profit + swap; entry and exit commission are not included. Both columns ignore the period |
| Equity | A small line of the closed-trade equity curve, up to 20 points, green or red |
What the profit factor and the drawdown say about an EA, and where they mislead, is explained in the guide Trading metrics: drawdown, profit factor, Sharpe.
How the drawdown is computed. The row's trades are taken in close-time order. The curve starts at 0 at the start of the period, and each trade adds its net result. Max DD is the largest fall from the highest point reached so far, the starting 0 included. So if an EA's first trade in the period loses 40, its Max DD is 40. The Total account row merges all trades of the period into one curve; its drawdown is usually smaller than the sum of the rows, because one EA's losses may coincide with another's gains – the point of the guide EA portfolio management.
Periods, sorting and the panel
- Tabs: TODAY, WEEK (from Monday 00:00), MONTH, YEAR, ALL and CUSTOM (from a date you set). All periods use the broker's server time. When a new day, week, month or year begins, the statistics are rebuilt from the trades already in memory.
- Sorting: click a column header (Trades, Win %, Net, PF, Max DD) to sort; click again to switch between descending and ascending.
- Split by symbol (input): each magic gets one row per symbol.
- Coverage line: number of trades, first and last close date, and the note that the drawdown excludes floating P/L.
- Colours: profit green, loss red; PF of 1.5 or more green, below 1.0 red.
- Long lines: MetaTrader 5 allows at most 63 characters in one text label. Logbook therefore splits long text lines – period, coverage, the unattributed-costs line and status messages – at spaces into several labels side by side. Long names are cut to the column width and end with "…".
- With more rows than Rows visible, ▲▼ buttons scroll the table. The panel can be minimised.
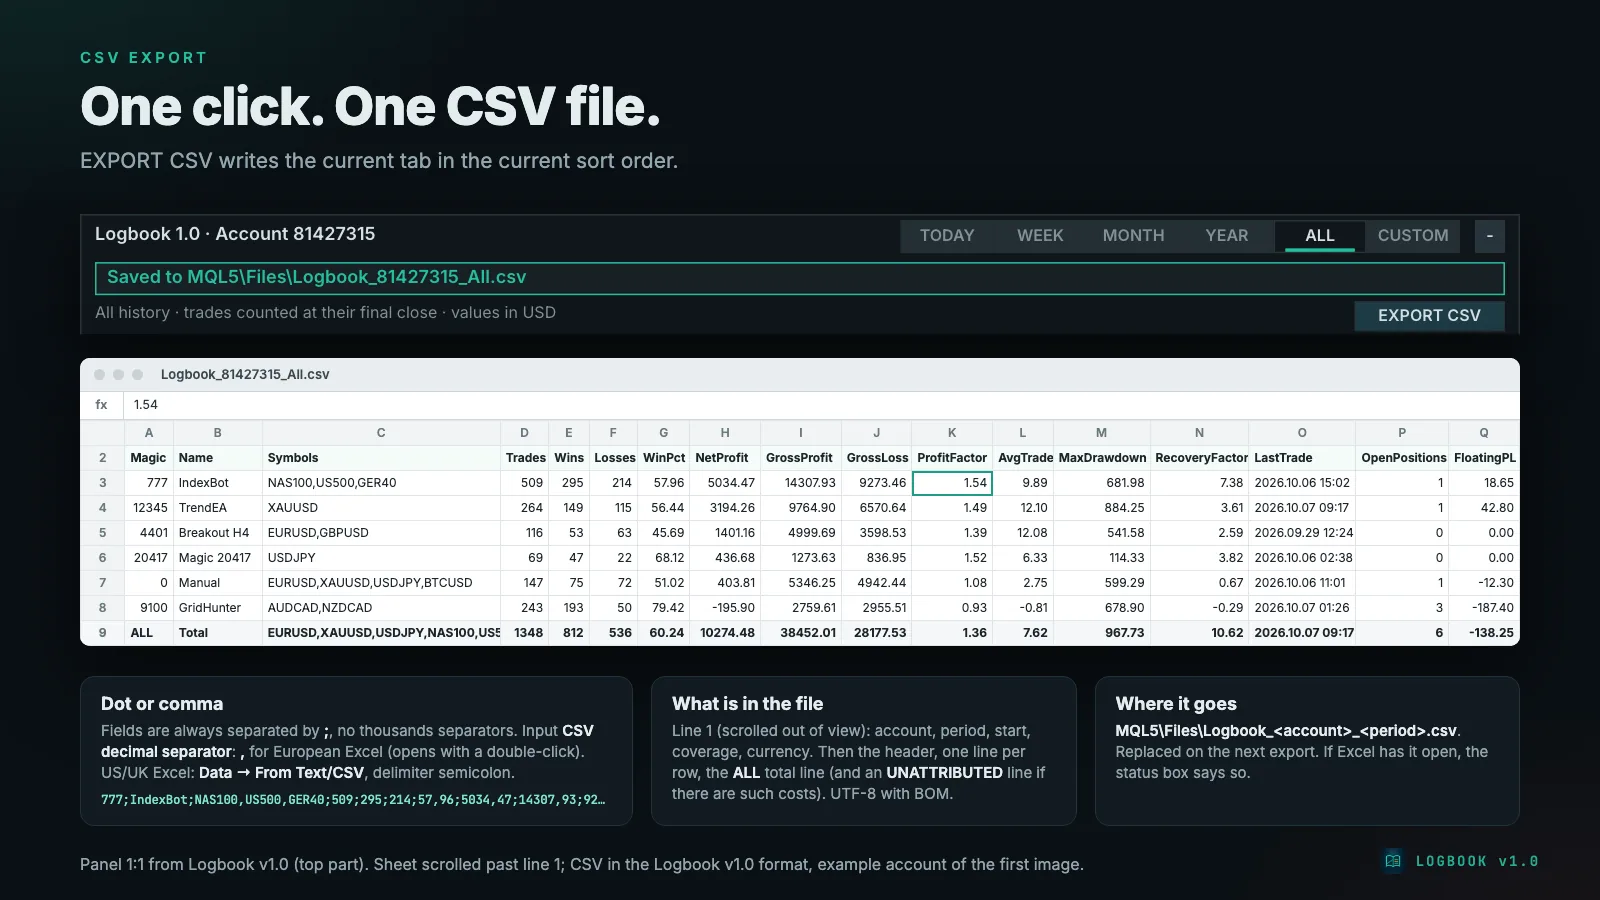
CSV export
EXPORT CSV writes the current period in the current sort order to MQL5\Files\Logbook_<account>_<period>.csv. The first line describes the export (account, period, start, coverage line, currency), the second is the header, then one line per row, the total as an ALL line and, if there are such costs, an UNATTRIBUTED line. Gross profit, gross loss, wins and losses are included as extra columns. Fields are separated by ;; the decimal separator is a dot or, for European Excel, a comma. The file is UTF-8, so names with non-Latin characters survive. If Excel has the file open, the status box says so and nothing is written.
Every setting
| Group | Setting | Default | Meaning |
|---|---|---|---|
| Data | Start period | All history | Active tab at the start; switch later with the tabs |
| Custom period: from | 2026.01.01 00:00 | Start of the CUSTOM tab, server time | |
| Names | empty | e.g. 12345=TrendEA;777=IndexBot; 0=My hand trades renames the manual row; the last entry wins if a magic appears twice | |
| Split every magic by symbol | off | One row per magic and symbol | |
| Refresh interval | 10 s | How often new deals and open positions are checked (2–300 s) | |
| Panel | Panel X / Y | 10 / 30 | Position of the top-left corner in pixels |
| Rows visible | 12 | Rows before the scroll buttons appear (3–30) | |
| Initial sort column | Net profit | Sorted descending at the start | |
| Start minimised | off | Only the title bar at the start | |
| CSV export | CSV decimal separator | dot | Comma for European Excel; the field separator is always ; |
Logbook remembers the active tab, the sort order, the scroll position and the minimised state per chart while the terminal runs, also across a timeframe change.
Setting up
- Drag Logbook onto any chart; symbol and timeframe do not matter. It can share the chart with an EA.
- On the first start it reads the complete history in slices of 2,000 deals, so the chart stays responsive; the status box shows the progress. After that it only processes new deals.
- If trades are missing: Toolbox → History, right-click, All history once.
- Optional: enter names for your magic numbers.
Large histories are no problem by design: after the first load only new deals are processed, and switching tabs only re-reads the trades already in memory.
Status and testing
Status 09.10.2026, tested on a RoboForex demo account, with the final build after an external code review by three AI models from other providers (GPT, Gemini, DeepSeek), whose valid findings were fixed:
- Self-test: 164 of 164 checks passed in the indicator tester, with no error lines. The self-test feeds synthetic deals through the same code that handles the real history – hedging and netting cases, partial closes, reversals, separate commission deals, period boundaries, names, CSV format and a block of 50,000 deals for speed.
- Live on the demo account: 8 EAs and 9,316 closed trades. The totals reconcile with the account, all panel lines are shown in full, and the CSV export and the period tabs were checked.
- Still open: the official check by the MQL5 validator and the release on the MQL5 Market (planned free).
Logbook gets no AlgoVerdict grade: our methodology rates Expert Advisors with their own strategy, and Logbook only measures.
Honest limits
- Only closed trades count. Realised partial closes of a position that is still open appear when it is fully closed.
- Max DD is closed-trade drawdown. The drawdown while a trade was open is not in it and can be much larger. That matters for grid and martingale EAs, whose closed trades look smooth while the open ones carry the risk – see Grid and martingale EAs.
- Floating P/L is profit + swap of the open positions. Entry and exit commission are not included; they are added to the trade when it closes.
- Only what the terminal's history contains. One Logbook per chart; in the Strategy Tester it only sees the tester's own deals.
- MetaTrader 5 only.
How AlgoVerdict itself shows real numbers per EA is on the page Every EA I run live.
Risk warning
The results Logbook shows describe your own history only and do not predict future performance. Trading forex and CFDs on margin carries a high risk of loss.
Where to get Logbook
Logbook is to be released free of charge on the MQL5 Market in the Utilities category for MT5 (technically an indicator). As soon as it is live, the link to the product page will be here. An overview of all three free tools is on the page Free MT5 tools.
Read on: Trading metrics explained · EA portfolio management · Equity curve explained · Every EA I run live